And to view multiple plots in one page, I referred to the below:
> old.par <- par(mfrow=c(1, 2))
> plot(faithful, main="Faithful eruptions")
> plot(large.islands, main="Islands", ylab="Area")
> par(old.par)

(Source: http://www.dummies.com/programming/r/how-to-put-multiple-plots-on-a-single-page-in-r/(
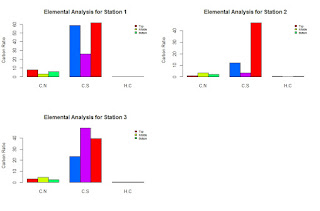
inserted with my data:
chns.par<-par(mfrow=c(2,2))
barplot(as.matrix(Maludam.December.2014.Station.1CHNS), main="Elemental Analysis for Station 1", ylab= "Carbon Ratio", beside=TRUE, col=rainbow(5)) + legend("topright", c("Top","Middle","Bottom"), cex=0.6,bty="n", fill=rainbow(5))
barplot(as.matrix(Maludam.December.2014.Station.2CHNS), main="Elemental Analysis for Station 2", ylab= "Carbon Ratio", beside=TRUE, col=rainbow(5)) + legend("topright", c("Top","Middle","Bottom"), cex=0.6,bty="n", fill=rainbow(5))
barplot(as.matrix(Maludam.December.2014.Station.3CHNS), main="Elemental Analysis for Station 3", ylab= "Carbon Ratio", beside=TRUE, col=rainbow(5)) + legend("topright", c("Top","Middle","Bottom"), cex=0.6,bty="n", fill=rainbow(5))
par(chns.par)
and I've noticed the colors were not representative of the core sections. Therefore:
chns.par<-par(mfrow=c(2,2))
barplot(as.matrix(Maludam_Dec2014_Station.1), main="Enzyme Assay for Maludam Station 1", ylab= "%", beside=TRUE, col=rainbow(3)) + legend("topright", c("Top","Middle","Bottom"), cex=0.6,bty="n", fill=rainbow(3))
barplot(as.matrix(Maludam_Dec14_Station3), main="Enzyme Assay for Maludam Station 3", ylab= "%", beside=TRUE, col=rainbow(3)) + legend("topright", c("Top","Middle","Bottom"), cex=0.6,bty="n", fill=rainbow(3))
barplot(as.matrix(Maludam_Dec2014_Station.5), main="Enzyme Assay for Maludam Station 5", ylab= "%", beside=TRUE, col=rainbow(3)) + legend("topright", c("Top","Middle","Bottom"), cex=0.6,bty="n", fill=rainbow(3))
Reference:
http://www.dummies.com/programming/r/how-to-put-multiple-plots-on-a-single-page-in-r/


